Debugging multilevel applications in C#
What is time travel debugging?
Standard Visual Studio debugging tool contains instruments such as step-into, step-over, or step-out. Reverse debugging allows you to travel in the opposite direction to inspect what causes the bug in your project. This infographic gives you a simple explanation of this process:
Reverse debugging tool for Visual Studio
RevDeBug is a Visual Studio extension for C# frameworks, which allows you not only to implement reverse debugging in your projects but also to monitor them on production. It creates a recording with all application states (values, methods calls, exceptions). With this information, you will be able to easily travel back in time, through every layer of your code. How does it work in practice? We may summarize that to these two steps:
- Recording of a session with a bug is being sent automatically from application user to developer.
- The developer is prospecting this stream of values to find the root of the problem.
This technology is particularly suitable for multilevel projects, where finding the root of the error may pose a big challenge. It also allows you to work with a problem without laborious bug recreating – as you are working on data straight from production.
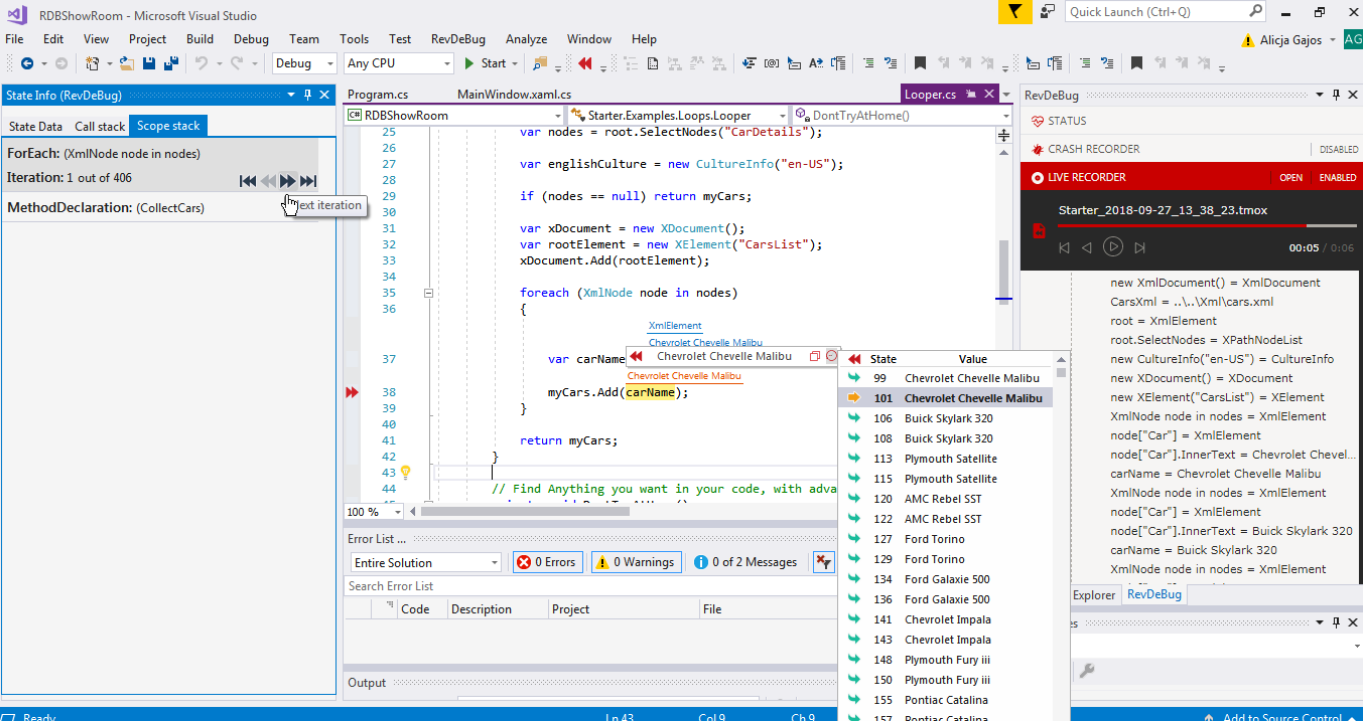
Challenges of debugging multithreaded applications are not simple to face. What’s more, threading problems are notoriously troublesome to replicate. Determining the state of the program at the time of failure can be difficult; understanding why a particular state is problematic can be even more demanding. That’s why reverse debugging technology is such an effective mechanism when it is coming to a crash. RevDebug allows you to track every thread of your application. Check out how it looks in the Visual Studio:
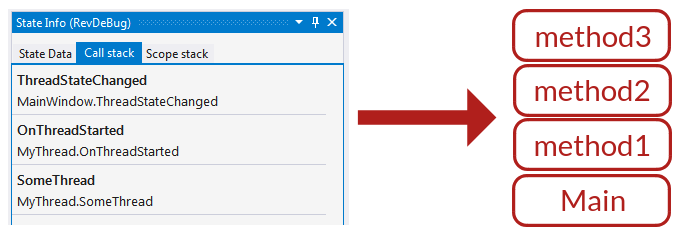
It’s not the only feature of RevDeBug, which supports developers in debugging complex applications. With the latest update, we give you also a call stack and scope stack (which provides fine-grained navigation within the current method and makes it easier to iterate over loops and conditionals).
Time traveling is only one function of RevDeBug, an advanced reverse debugger for c# applications. Want to know more? Check out our other articles:
How to use RevDeBug performance profiler?
Infographic: How to debug on production?
How to debug mobile apps on production?
Our most popular articles:
- Azure Functions: Overview and Common Use Cases
- How to enable error reporting and monitoring for Azure Functions
Our Linkedin profile: