RevDeBug 3.0 – Local and remote reverse debugging
Don’t debug – replay! RevDeBug allows you to inspect past application state and performance profiles, even directly from production environments. I am introducing RevDeBug version 3.0, prettier, and easier to use than ever before!
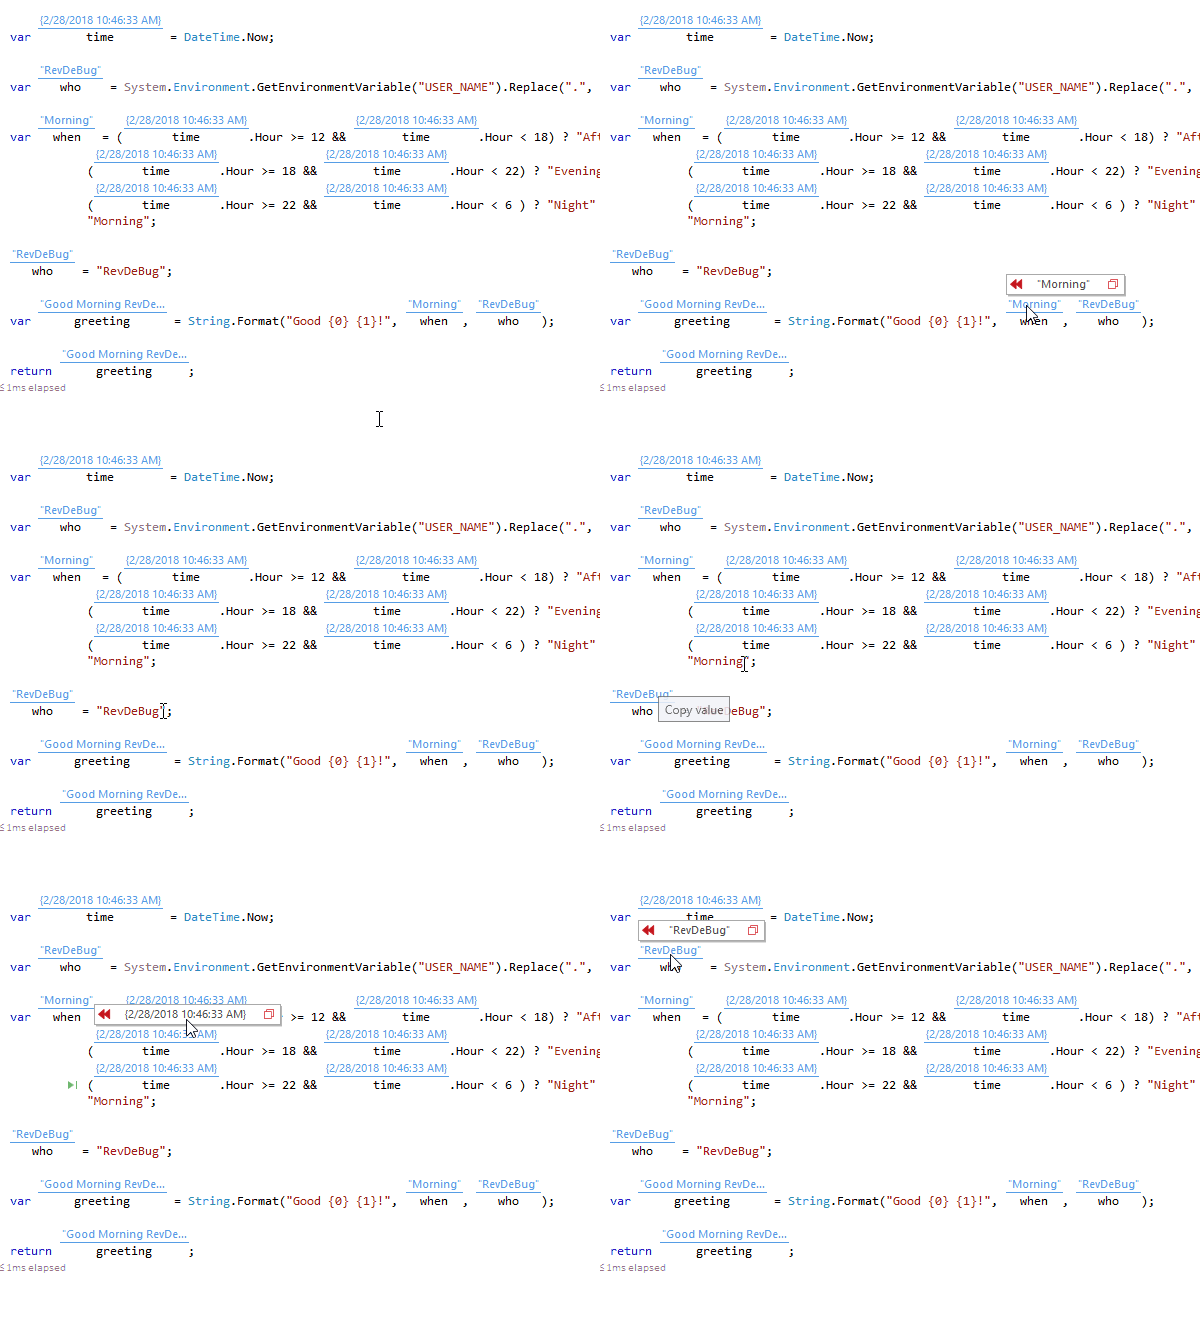
Value Prompts directly in code
Have you ever wondered how awesome it could be if you could stop worrying about writing everything into the watch? Prompter is your answer. It allows you to see values right in your code during debugging, with customizable, real-time prompts. This used to be a standalone app called Prompter, but since 3.0, it rolled into the main branch of RevDeBug. What’s more, this feature works even if your RDB license is invalid, as a gift from us!
Support for Cloud

In addition to .NET Core, RevDeBug now allows you to monitor, profile, and debug applications running on Amazon Web Services, Microsoft Azure, and Google’s Kubernetes.
Recording the exact state of remote applications is done via a single click, and you can have an unlimited amount of applications, both staging and production ones.
Even better, RevDeBug can now switch between your applications without the need to rebuild them.
RevDeBug Server

One of RDB’s significant features is the ability to not only connect to a remote application but to save the recordings and share them with others. We make communication between testers and developers dramatically more efficient and effective, avoiding the usual overheads of preparing lengthy instructions, complex test data, simulated user environment, or added diagnostic code to replicate the problem.
RevDeBug is now Dockerized for faster and easier deployments, plus any recording you make you can share without leaving the application! No need to send stuff via WeTransfer or, heavens forbid physical media.
Further, RevDeBug now stores all recordings in one convenient place, so you can focus on hunting bugs instead of chasing the files on how to reproduce them.
Light-weight session recording

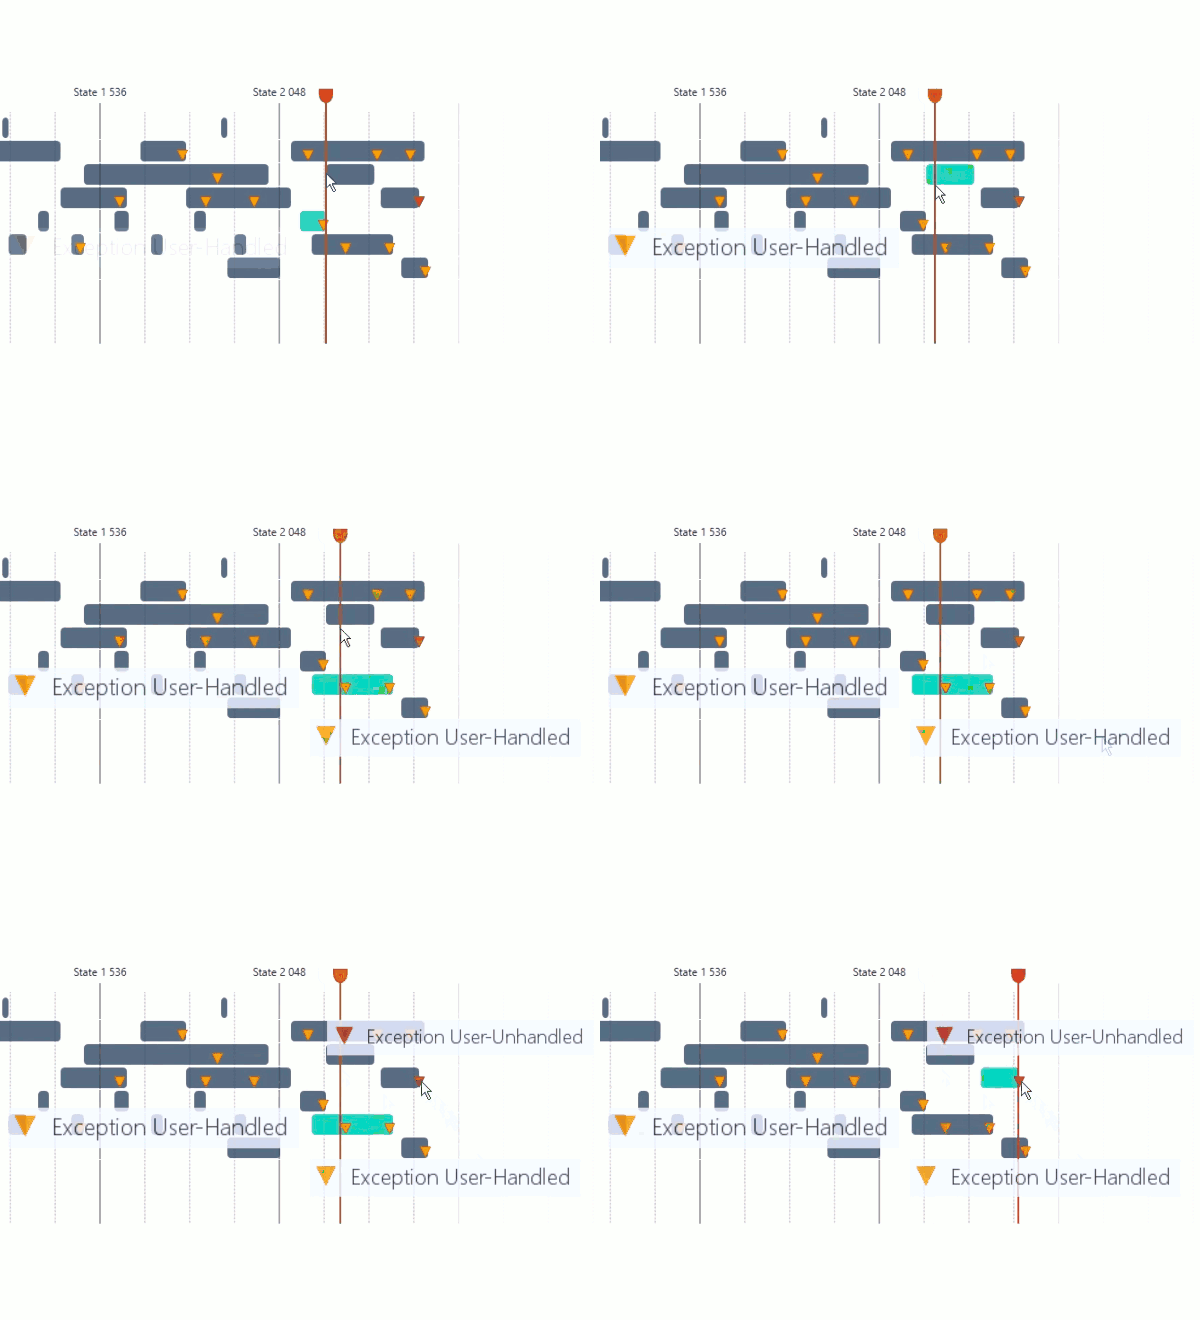
A light-weight type of session recording called Monitoring comes with 3.0. It focuses only on critical data and saves you disk space. Having fewer files to browse and only the important stuff on top also means less time on your side. RevDeBug can record exceptions in your applications, even remote production ones, with mere kilobytes of space and nearly instantaneously.
Sounds like a good trade-off, right?
RevDeBug is easy to use
We have tweaked the UI to make it more accessible and intuitive. After launching RevDeBug, you will see a welcome screen showing you the functionality of:
- Value Prompts directly in code
- Monitoring for errors and exceptions
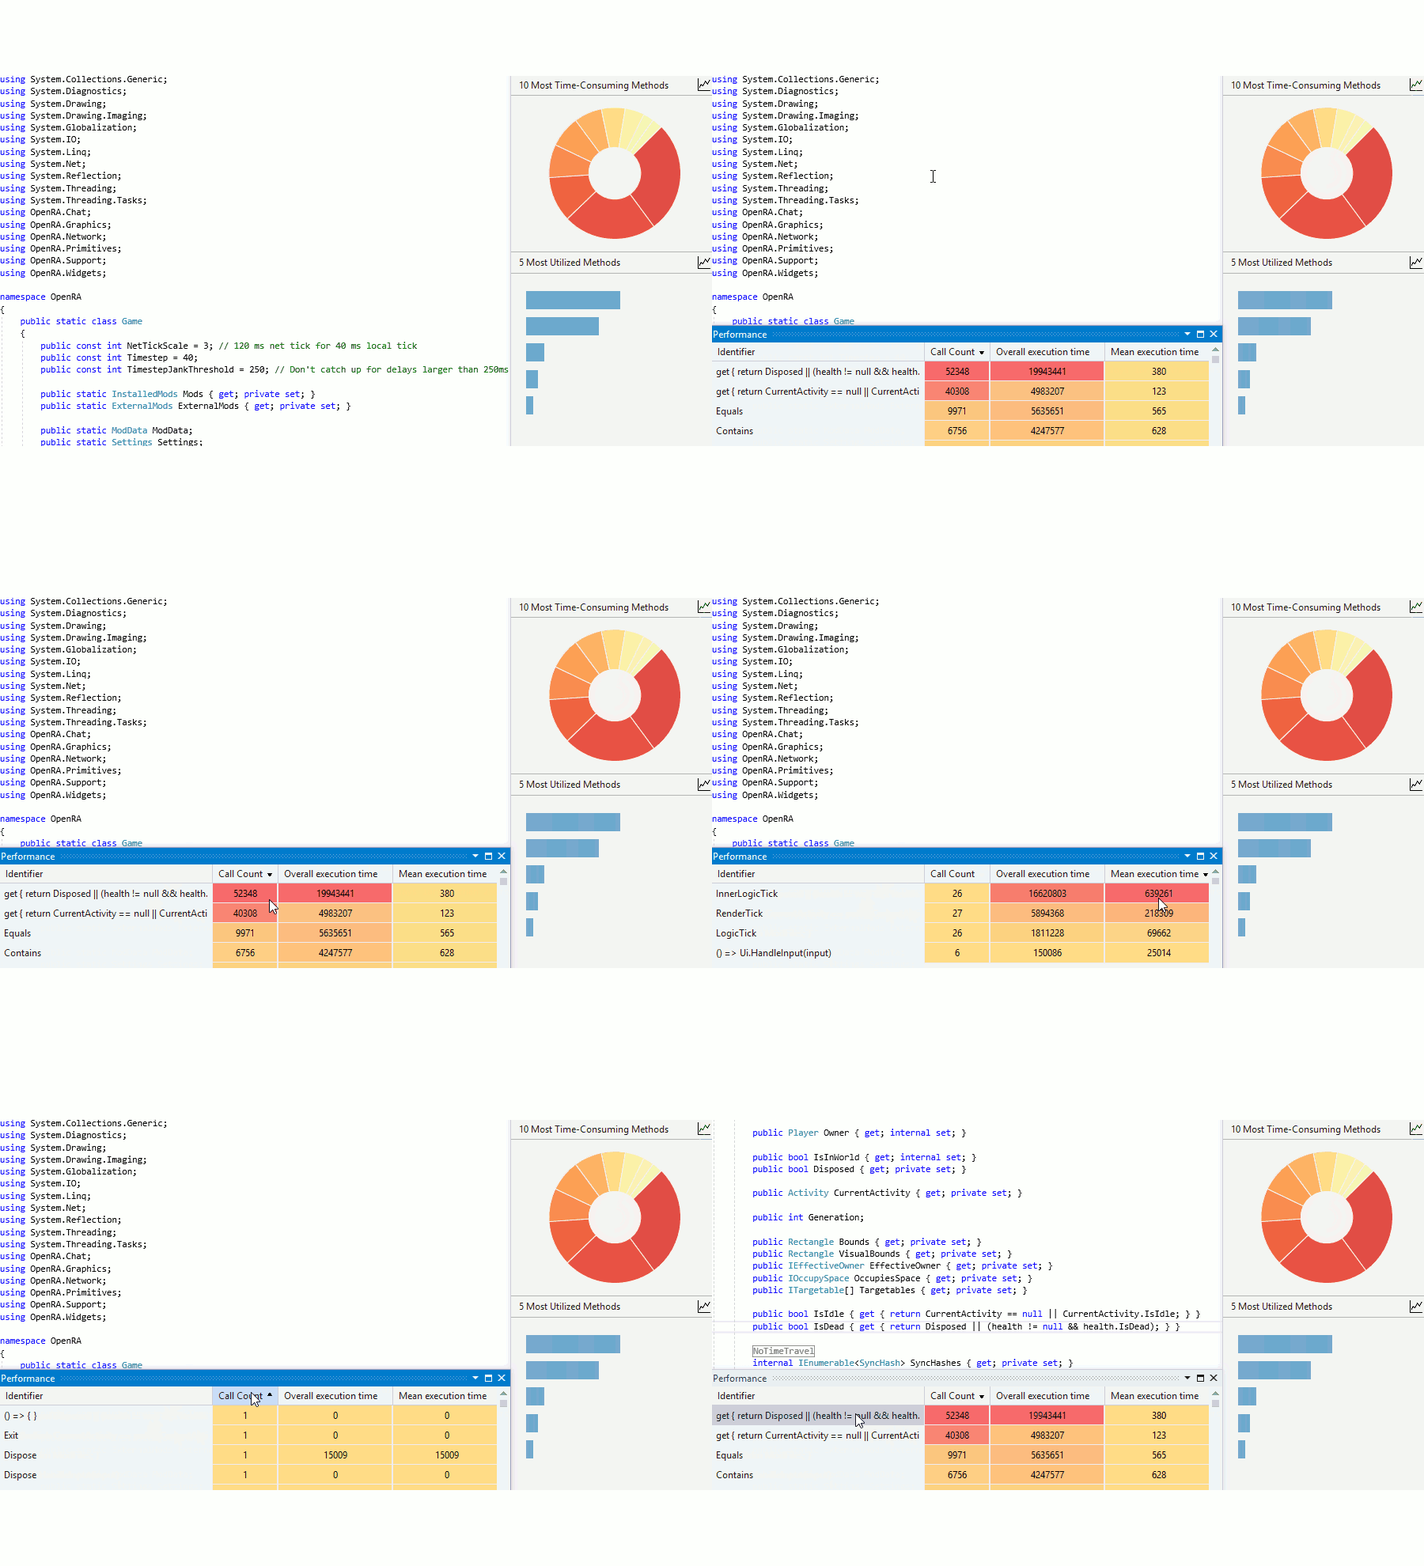
- Profiling to find performance bottlenecks
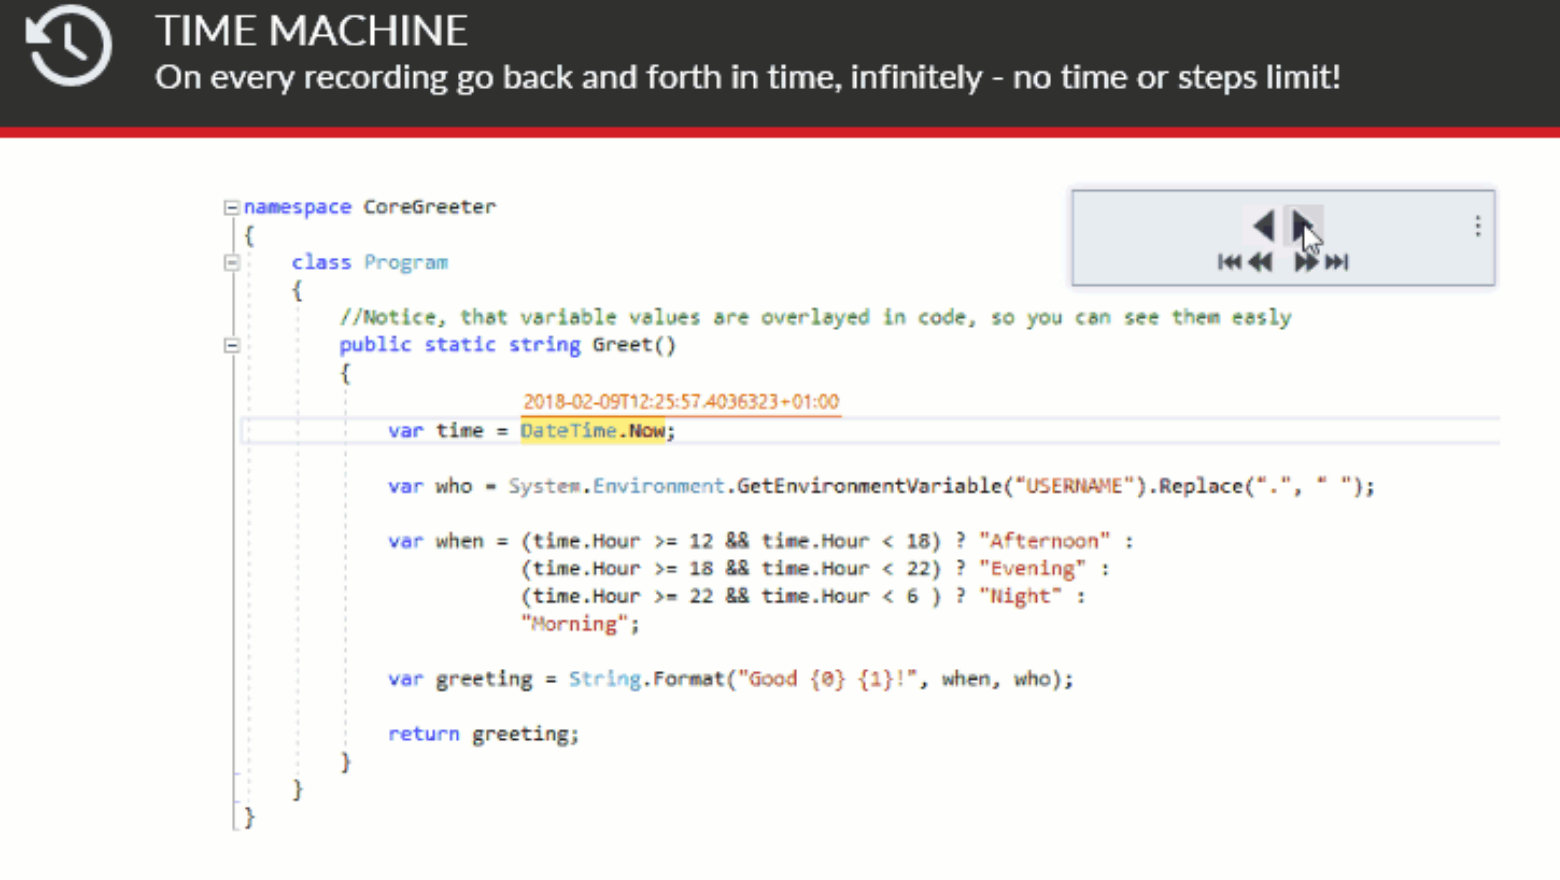
- Time Machine – go back and forth in time infinitely
- Session recording of local and remote environments, even production
- Saving and sharing your recording
Licenses and updates are now handled automatically inside RevDeBug, without disrupting your workflow. Download and get debugging right away!
 Our most popular articles:
- Azure Functions: Overview and Common Use Cases
- How to enable error reporting and monitoring for Azure Functions
Our Linkedin profile: