Redgate Oracle Team and RevDeBug
About Redgate
With over 800,000 users, Redgate Software is a market leader in database development solutions, helping organizations satisfy their Compliant Database DevOps needs.
Redgate’s Source Control for Oracle tools is the cornerstone of Redgate’s Database DevOps offering, allowing customers to manage their development databases in version control seamlessly. It works by linking a development database with a version control repository and automatically translates detected changes into their constituent object creation scripts and migration scripts.
The elusive crash: why Redgate decided to work with RevDeBug
When errors occur, either as part of development or reported by a customer, they can be extremely tricky to reproduce, requiring access to a specific Oracle server instance and database.
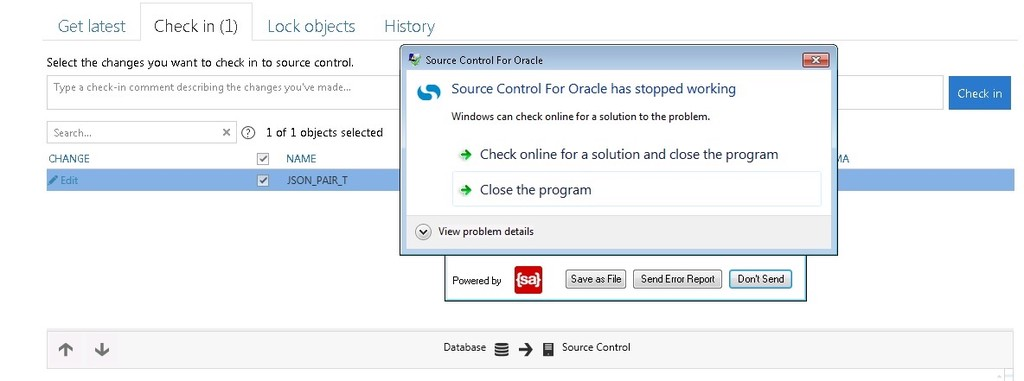
One recent error was discovered by a client for whom the tool crashed each time they tried to view changes in one of their tables.
In some specific, rare conditions, the highlighting of the changes in SQL had its UI area miscalculated and ran outside the bounds of the displayed SQL text, causing the UI element to crash.
To make matters worse, this error caused an immediate crash outside the managed code as it happened during the refresh of the whole UI component tree. It crashed not only the application but also the .NET’s virtual machine without leaving a trace to aid the debugging process.

How RevDeBug helped Redgate find the root cause of the problem
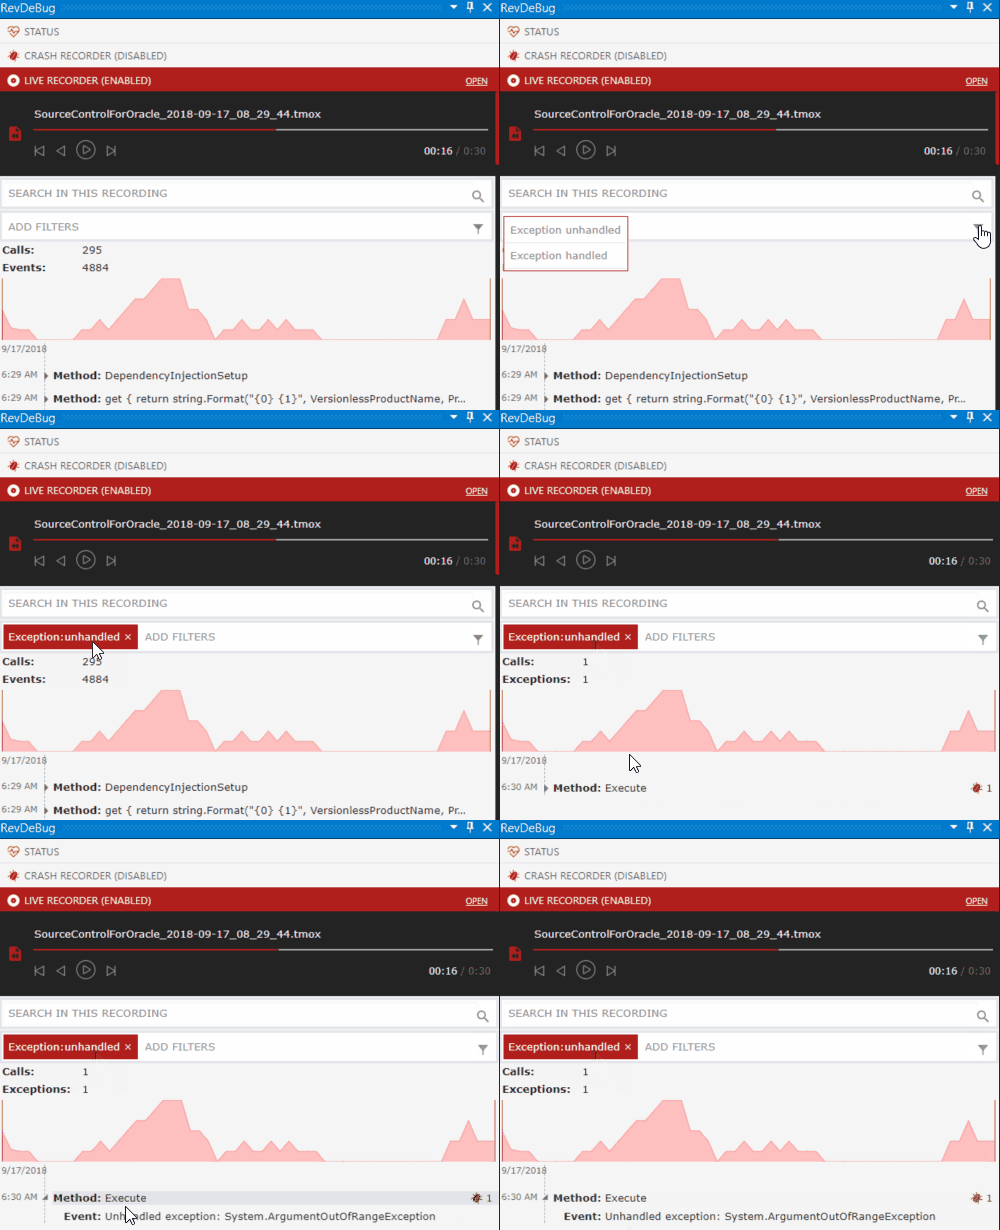
After building a new version of the application following the implementation of RevDeBug, the developer obtained a recording from the clients’ device, revealing just one unhandled exception:

The RevDeBug recording contains all values, method calls, and exceptions, which can be filtered.
The RevDeBug recording contains all values, method calls, and exceptions, which can be filtered.
Users can navigate to the code by drilling down into the exception.
 Values from the production recordings are annotated on the applicable code in Visual Studio
Armed with this data, the developers quickly concluded that the problem laid in the difference between the names of the database schemas.
The first step was to attempt to reproduce the bug in development, which can sometimes be the simplest way of debugging and diagnosing a problem. However, in this case, the efforts were fruitless.
Historically, the team would have spent a lot more time, at times days, experimenting in the dark, in a desperate attempt to identify the root cause. Now, a much more practical solution has been adopted that leverages RevDeBug’s reverse debugging technology.
It works by using pre-built binaries of the tools in question, instrumented with RevDeBug. If a customer finds a bug, they can watch a complete recording of the sequence of events that led to the elusive crash.
This provides crucial information allowing the developers to trace back the executed code from the moment the application crashed through every line of code and every variable value. With RevDeBug, developers can identify and fix such issues far quicker than using traditional means, which benefits development efficiency, as a result reducing the customer feedback loop.
“My team uses RevDeBug for all those elusive and hard to reproduce bugs – it speeds up the time to diagnose issues, allowing us to be much more responsive to our customers.”
David Atkinson, Head of Product Strategy at Redgate
Our most popular articles:
- Azure Functions: Overview and Common Use Cases
- How to enable error reporting and monitoring for Azure Functions
Our Linkedin profile: