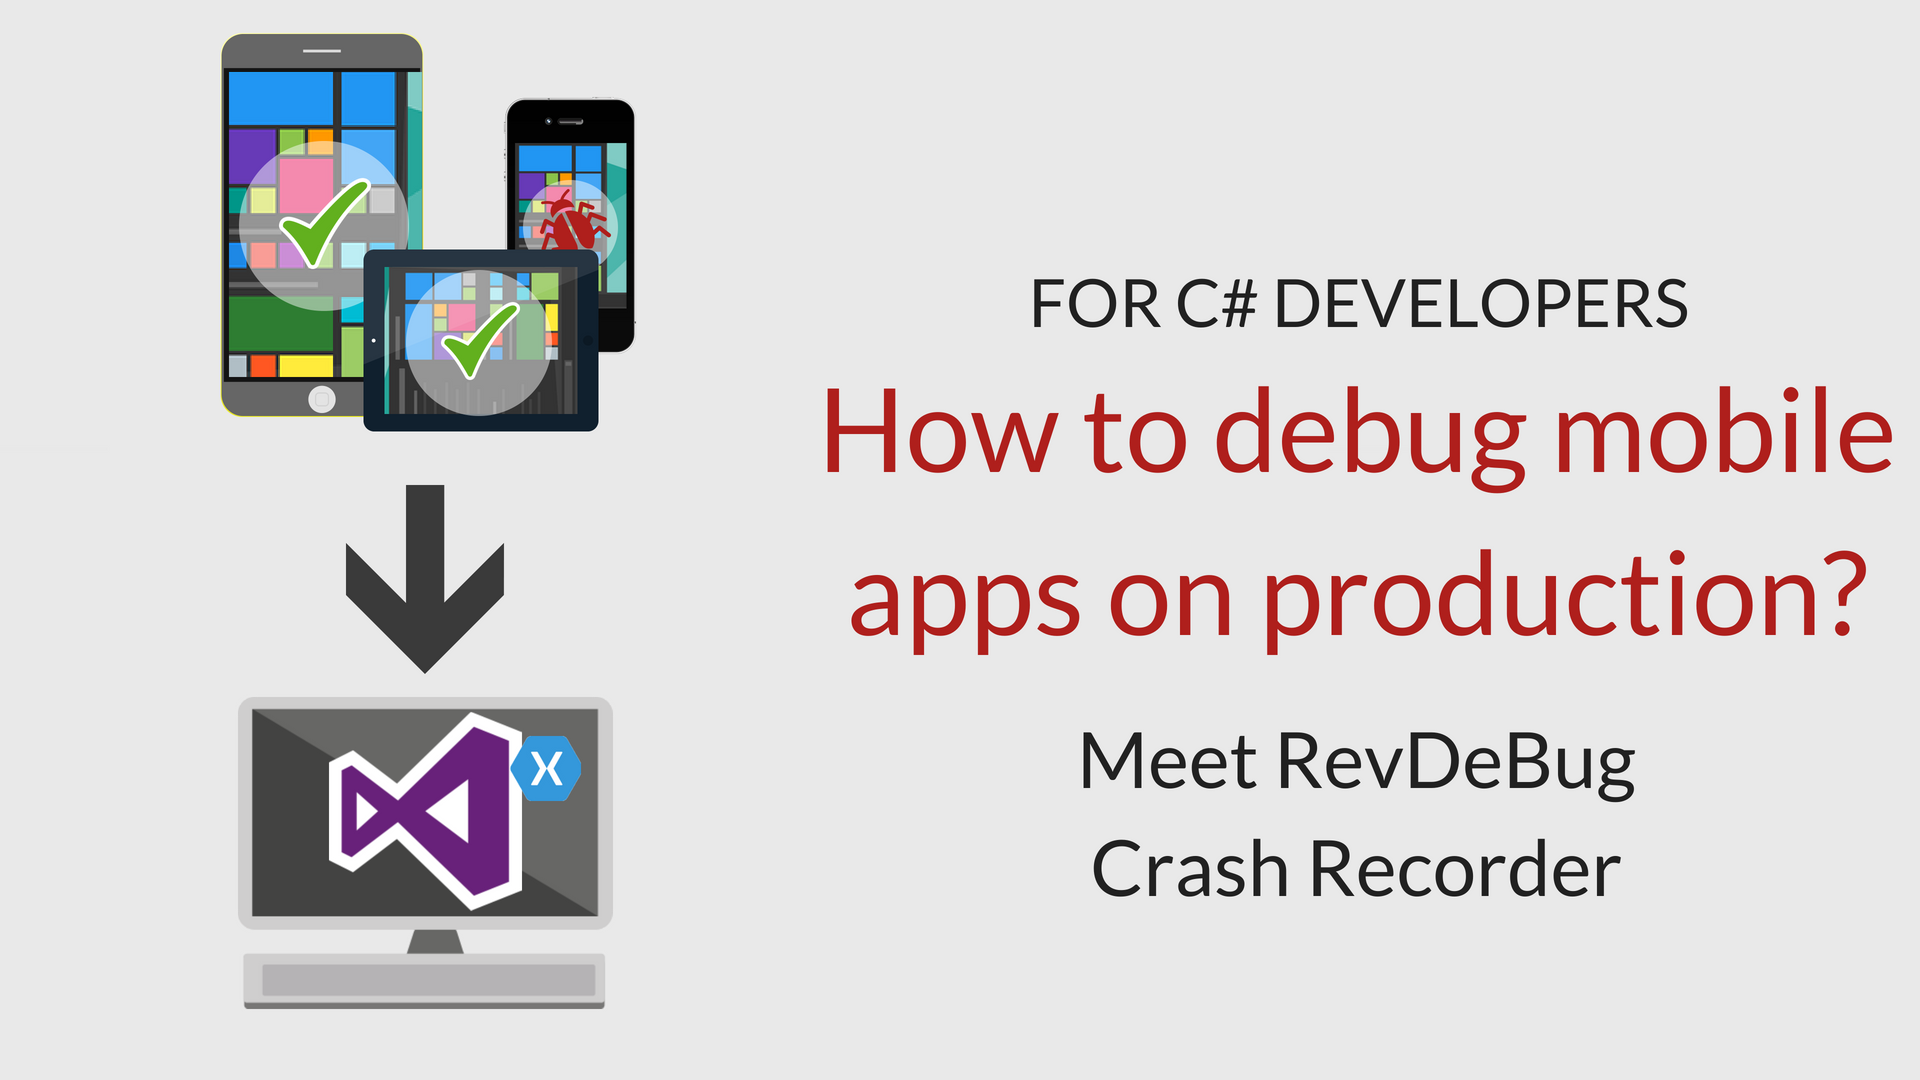
How to find out what happens with your application?
As we all know, software development of applications is not only about coding but also about documenting, testing, and bug fixing. On the Web, you can find an endless amount of tools supporting that process at the development stage, but almost none are collecting data from your client machine. Does that mean that on production we should desist those actions? According to DevOps, specialists’ only continuous deployment of your application may shorter development cycles and cut deployment failures. You may wonder – is there any way to find out what happens with your requests on production? How to make it better? We want to show you a unique recorder for Visual Studio, which allows you to dive into your app, and take a closer look at its behavior in every environment.
A .NET tool, which allows you to record actions of your program
Have you ever heard about reverse debugging? It bases on the concept of a black airplane box. Just like a flight recorder, it records everything that happens on a plane during flight, RevDeBug is a tool which records everything that happens with your application during operating.
1. Download RevDeBug for free from the Microsoft Marketplace
RevDeBug is a Visual Studio extension, available at the Microsoft Marketplace. After downloading and installing it, you will be able to build your projects with it.
2. Build your project with RevDeBug
Now you may record your projects at your personal computer. The recording will extract automatically after turning off your application.
3. Configure your server for recordings
Server with recording storage will be necessary to start record manually on production.
You will find a detailed tutorial on how to configure your server at RevDeBug docs.
4. Download the recording from the server to find out how your application runs on production.
RevDeBug recordings contain everything that happens at your application – every exception, every value, every call of every method from every line of your code. In the beginning, it might be challenging for you to navigate through this data; that’s why RevDeBug provides you with tools that make everything a lot simpler.
How to navigate through RevDeBug recordings?
Navigation bar
You could investigate your recording step by step using the navigation bar. It will pinpoint the places in the code which were called while the application was running.
Timeline
The timeline displays a list of events in chronological order.
Take a closer look into every thread of your application
RevDeBug allows you also to record multithreaded applications. This tool is separating them to give you a better understanding of what happening at your application.
Search
RevDeBug is equipped with its search engine. It searches through the recording: values, methods, and exceptions. You may also apply some filters, which allows you to sight handled or unhandled exceptions or take a closer look into a specific period of recording time.
Our most popular articles:
- Azure Functions: Overview and Common Use Cases
- How to enable error reporting and monitoring for Azure Functions
Our Linkedin profile: